How to build systems that engineers can understand, debug, and trust in production
Introduction
In distributed systems, the question is not "if" something will fail, but "when" and "how quickly can we understand what happened." Observability is the difference between spending hours debugging production incidents and identifying root causes in minutes.
This guide explores how to design systems with observability built-in from day one, covering the three pillars of observability and practical implementation strategies.
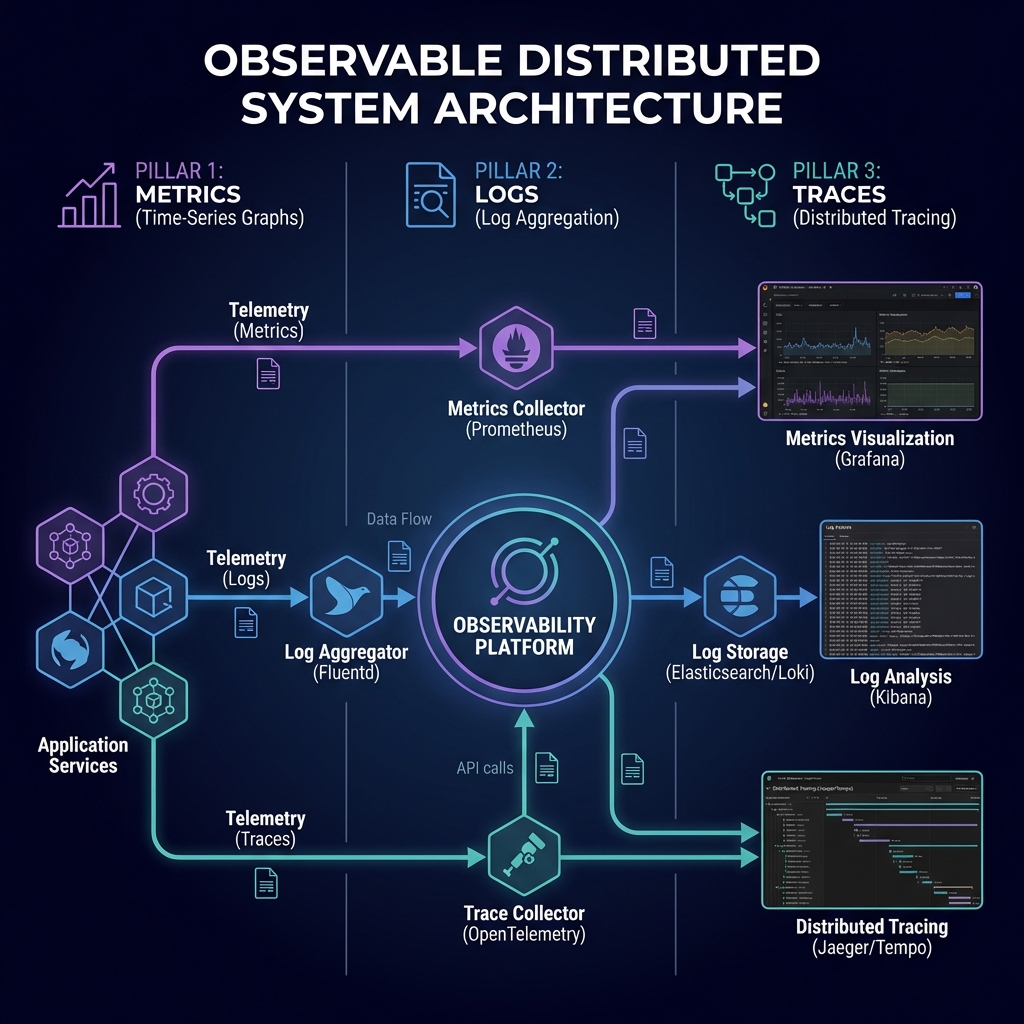
The Three Pillars of Observability
Modern observability rests on three interconnected pillars: Metrics, Logs, and Traces. Each provides a different lens into system behavior, and together they enable comprehensive understanding.
1. Metrics: The System's Vital Signs
Metrics are numerical measurements collected over time. They're your first line of defense in detecting anomalies and understanding system health.
The Four Golden Signals
Google's Site Reliability Engineering team identified four critical metrics that matter for any user-facing system:
Latency: How long requests take to process
Traffic: How many requests the system is handling
Errors: Rate of failed requests
Saturation: How "full" your service is (CPU, memory, I/O)
from prometheus_client import Counter, Histogram, Gauge
import time

# Define metrics
request_count = Counter(
    'http_requests_total',
    'Total HTTP requests',
    ['method', 'endpoint', 'status']
)

request_duration = Histogram(
    'http_request_duration_seconds',
    'HTTP request latency',
    ['method', 'endpoint']
)

active_requests = Gauge(
    'http_requests_active',
    'Number of active HTTP requests'
)

# Instrument your code
def handle_request(method, endpoint):
    active_requests.inc()
    start_time = time.time()

    try:
        # Your application logic
        result = process_request(method, endpoint)
        status = 200
        return result
    except Exception as e:
        status = 500
        raise
    finally:
        duration = time.time() - start_time
        request_duration.labels(method=method, endpoint=endpoint).observe(duration)
        request_count.labels(method=method, endpoint=endpoint, status=status).inc()
        active_requests.dec()
Business Metrics Matter
Beyond system metrics, track business-level metrics that indicate real user impact:
# Business metrics examples
signup_success_rate = Gauge(
    'user_signup_success_rate',
    'Percentage of successful user signups'
)

payment_processing_duration = Histogram(
    'payment_processing_seconds',
    'Payment processing duration',
    buckets=[0.1, 0.5, 1.0, 2.5, 5.0, 10.0]
)

cart_abandonment_rate = Gauge(
    'cart_abandonment_rate',
    'Percentage of shopping carts abandoned before checkout'
)
💡 Pro Tip
Use high-cardinality dimensions sparingly in metrics. User IDs or request IDs create storage explosions. Save those for logs and traces.
2. Logs: The Detailed Event Stream
Logs capture discrete events with rich context. When metrics show something is wrong, logs tell you what happened.
Structured Logging
Structured logs in JSON format enable powerful querying and correlation across services.
import structlog
import uuid

# Configure structured logging
structlog.configure(
    processors=[
        structlog.processors.TimeStamper(fmt="iso"),
        structlog.stdlib.add_log_level,
        structlog.processors.StackInfoRenderer(),
        structlog.processors.format_exc_info,
        structlog.processors.JSONRenderer()
    ]
)

logger = structlog.get_logger()

def process_order(order_id, user_id, items):
    # Add context that will appear in all subsequent logs
    log = logger.bind(
        order_id=order_id,
        user_id=user_id,
        trace_id=str(uuid.uuid4())
    )

    log.info("order_processing_started", item_count=len(items))

    try:
        # Validate inventory
        for item in items:
            if not check_inventory(item):
                log.warning(
                    "insufficient_inventory",
                    item_id=item['id'],
                    requested_quantity=item['quantity']
                )
                raise InventoryException(f"Insufficient inventory for {item['id']}")

        # Process payment
        payment_result = process_payment(order_id, user_id)
        log.info(
            "payment_processed",
            payment_id=payment_result['payment_id'],
            amount=payment_result['amount']
        )

        log.info("order_completed", status="success")
        return payment_result

    except Exception as e:
        log.error(
            "order_processing_failed",
            error_type=type(e).__name__,
            error_message=str(e),
            exc_info=True
        )
        raise
Structured Logging Best Practices:
Consistent Schema: Define standard fields (timestamp, level, service, trace_id, user_id)
Contextual Binding: Attach relevant context early, it flows through all subsequent logs
Appropriate Levels: DEBUG for development, INFO for significant events, WARN for degraded states, ERROR for failures
Security: Never log sensitive data (passwords, tokens, PII unless masked)
Cost-Aware: Log verbosity directly impacts storage costs; use sampling for high-volume events
Log Aggregation
# Fluentd/Fluent Bit configuration for log shipping

  @type tail
  path /var/log/app/*.log
  pos_file /var/log/td-agent/app.log.pos
  tag app.logs

    @type json
    time_key timestamp
    time_format %Y-%m-%dT%H:%M:%S.%L%z


  @type record_transformer

    hostname "#{Socket.gethostname}"
    environment "#{ENV['ENVIRONMENT']}"
    service "#{ENV['SERVICE_NAME']}"


  @type elasticsearch
  host elasticsearch.internal
  port 9200
  index_name app-logs-%Y.%m.%d
  type_name _doc


    @type file
    path /var/log/td-agent/buffer/app
    flush_interval 5s
    flush_at_shutdown true
3. Distributed Tracing: Following Requests
In microservices, a single user request might traverse 10+ services. Tracing reconstructs the full journey, showing where time was spent and where failures occurred.
OpenTelemetry Implementation
from opentelemetry import trace
from opentelemetry.exporter.otlp.proto.grpc.trace_exporter import OTLPSpanExporter
from opentelemetry.sdk.trace import TracerProvider
from opentelemetry.sdk.trace.export import BatchSpanProcessor
from opentelemetry.instrumentation.fastapi import FastAPIInstrumentor
from opentelemetry.instrumentation.requests import RequestsInstrumentor

# Initialize tracer provider
trace.set_tracer_provider(TracerProvider())
tracer = trace.get_tracer(__name__)

# Configure OTLP exporter (sends to Jaeger, Tempo, etc.)
otlp_exporter = OTLPSpanExporter(
    endpoint="http://otel-collector:4317",
    insecure=True
)

# Add batch span processor
span_processor = BatchSpanProcessor(otlp_exporter)
trace.get_tracer_provider().add_span_processor(span_processor)

# Auto-instrument FastAPI and requests library
FastAPIInstrumentor.instrument()
RequestsInstrumentor.instrument()

# Manual instrumentation for business logic
async def checkout_order(order_id: str, user_id: str):
    with tracer.start_as_current_span(
        "checkout_order",
        attributes={
            "order.id": order_id,
            "user.id": user_id
        }
    ) as span:

        # Validate cart
        with tracer.start_as_current_span("validate_cart") as validate_span:
            cart = await get_cart(user_id)
            validate_span.set_attribute("cart.item_count", len(cart.items))

            if not cart.items:
                span.set_status(Status(StatusCode.ERROR, "Empty cart"))
                raise ValueError("Cannot checkout empty cart")

        # Process payment
        with tracer.start_as_current_span("process_payment") as payment_span:
            payment_result = await payment_service.charge(
                user_id=user_id,
                amount=cart.total
            )
            payment_span.set_attributes({
                "payment.id": payment_result.id,
                "payment.amount": cart.total,
                "payment.status": payment_result.status
            })

        # Create order
        with tracer.start_as_current_span("create_order"):
            order = await order_service.create(
                user_id=user_id,
                items=cart.items,
                payment_id=payment_result.id
            )

        span.set_attribute("order.status", "completed")
        return order
Trace Context Propagation
Critical for distributed tracing: propagate trace context across service boundaries.
import httpx
from opentelemetry.propagate import inject

async def call_downstream_service(endpoint: str, data: dict):
    """Call downstream service with trace context propagation"""

    headers = {}
    # Inject current trace context into headers
    inject(headers)

    async with httpx.AsyncClient() as client:
        response = await client.post(
            f"http://order-service/{endpoint}",
            json=data,
            headers=headers,
            timeout=5.0
        )

        return response.json()
Practical Observability Patterns
Pattern 1: Correlation IDs
Generate a unique ID at the edge and pass it through all services. This ties metrics, logs, and traces together.
from fastapi import FastAPI, Request
from contextvars import ContextVar
import uuid

request_id_ctx: ContextVar[str] = ContextVar('request_id', default=None)

app = FastAPI()

@app.middleware("http")
async def add_request_id(request: Request, call_next):
    # Extract or generate request ID
    request_id = request.headers.get('X-Request-ID', str(uuid.uuid4()))
    request_id_ctx.set(request_id)

    # Add to response headers
    response = await call_next(request)
    response.headers['X-Request-ID'] = request_id
    return response

# Use in logging
def get_logger():
    return structlog.get_logger().bind(request_id=request_id_ctx.get())
Pattern 2: Health Checks & Readiness Probes
@app.get("/health/live")
async def liveness():
    """Liveness probe - is the service running?"""
    return {"status": "alive"}

@app.get("/health/ready")
async def readiness():
    """Readiness probe - can the service handle traffic?"""
    checks = {
        "database": await check_database(),
        "redis": await check_redis(),
        "external_api": await check_external_api()
    }

    all_healthy = all(checks.values())
    status_code = 200 if all_healthy else 503

    return JSONResponse(
        status_code=status_code,
        content={
            "status": "ready" if all_healthy else "not_ready",
            "checks": checks
        }
    )
Pattern 3: Circuit Breakers
Prevent cascading failures by failing fast when downstream services are unhealthy.
from pybreaker import CircuitBreaker

# Configure circuit breaker
payment_breaker = CircuitBreaker(
    fail_max=5,              # Open after 5 failures
    timeout_duration=60,     # Stay open for 60 seconds
    exclude=[TimeoutError]   # Don't count timeouts as failures
)

@payment_breaker
async def call_payment_service(user_id: str, amount: float):
    """Call payment service with circuit breaker protection"""
    try:
        async with httpx.AsyncClient() as client:
            response = await client.post(
                "http://payment-service/charge",
                json={"user_id": user_id, "amount": amount},
                timeout=3.0
            )
            response.raise_for_status()
            return response.json()
    except httpx.HTTPError as e:
        logger.error("payment_service_error", error=str(e))
        raise

# Handle circuit breaker open state
try:
    result = await call_payment_service(user_id, amount)
except CircuitBreakerError:
    logger.warning("payment_circuit_open", user_id=user_id)
    # Fallback behavior: queue for later processing
    await queue_payment_for_retry(user_id, amount)
Observability Stack Recommendations
Self-Hosted Stack
Metrics: Prometheus + Grafana
Logs: Loki + Promtail or ELK Stack (Elasticsearch, Logstash, Kibana)
Traces: Tempo or Jaeger
Unified: Grafana for visualization across all three pillars
Managed Solutions
AWS: CloudWatch (metrics, logs) + X-Ray (traces)
Datadog: All-in-one observability platform
New Relic: Full-stack observability
Honeycomb: Modern observability for high-cardinality data
Building an Observability Culture
Technology alone isn't enough. You need organizational practices:
Observability Champions: Designate team members to own observability standards
Dashboard Reviews: Regular review of key dashboards in team meetings
Incident Retrospectives: Always ask "How could observability have helped us detect this faster?"
Runbook Documentation: Document common issues and their observability signatures
SLO-Driven Alerts: Alert on what matters (SLO violations), not noisy symptoms
🎯 Start Small, Iterate
Don't try to instrument everything at once. Start with your critical path, prove value, then expand. Focus on what helps you answer questions during incidents.
Conclusion
Observable systems aren't just easier to debug—they're easier to trust, evolve, and operate. By designing observability into your architecture from the start, you transform firefighting into systematic problem-solving.
The investment in observability pays dividends every time you resolve an incident in minutes instead of hours, every time you catch a regression before it impacts users, and every time you confidently deploy to production.
Key Takeaways
Implement all three pillars: metrics, logs, and traces—each provides unique insights
Use structured logging with consistent schemas and correlation IDs
Instrument the four golden signals: latency, traffic, errors, saturation
Propagate trace context across service boundaries for end-to-end visibility
Build observability into the development workflow, not as an afterthought
Alert on business-impacting SLO violations, not every symptom